
Understanding the Data Science job market in Atlanta using Cosine Similarity and GMaps
Executive Summary
There exist websites that provide you a match percentage of ones resume against a job description. There exist websites that provide a geographic representation of jobs in a given area. There exist services that provide real-time traffic visual representation in a given area. However – there is not a service that provides all these three data points simultaneously. I believe a service that provides this could help job seekers be more informed in the decisions they are making about their careers.
Example: A job seeker that moves into a new city can better compare different opportunities based on commute distance and typical traffic patterns.
Problem Statement
Can a platform be created where job seekers are provided a better visual and analytical overview of jobs they are considering?
Anticipated Results:
A model that can predict the cosine_similarity between two or more documents. I then use these results to provide a visual overview of the best matching jobs to one’s profile.
Scope Statement
As with any project – a precise and succinct scope statement is needed to ensure that all the objectives are met.
1) Provide a visual overview of the data science jobs available in the Atlanta area.
2) Provide a percentage match between a resume and a job description.
3) Provide a visual representation of typical traffic patterns for the opportunities.
Summary
To accomplish the scope above the following procedures were utilized.
1. Examine different models to determine which model would provide the best results for document comparisons.
2. Examine different platforms to determine which would provide the best map layout overview.
3. Examine which platforms can accommodate a traffic overview
Anticipated Risks
1. Have not used Gmaps previously. I do not know at this time how complicated this could be.
2. Contingency Plan: Use Tableau Map function
3. Converting scraped job descriptions into individual CSV files.
4. Contingency Plan: May need to just do each on a manual basis. I could probably manage at least 50 individual jobs. This should be enough to conduct an analysis for the Atlanta area.
Project Schedule
I realized that I would need to balance the capstone with the rest of the work that needed to be done to fulfill graduation requirements. A project schedule needed to be created to make sure all the phases were completed on time and other competing works were addressed appropriately.
import pandas as pd
pd.read_excel('Project Schedule.xlsx')
Code Snippets
Please note – I am presenting here code snippets from my overall project.
This is not the entirety of the code but examples of the work involved in the overall project.
Code Snippet: Initial Scraping Work using BeautifulSoup
max_results_per_city = 1000
results = []

for city in indeed_cities:
    for start in range(0, max_results_per_city, 100):
        url = "https://www.indeed.com/jobs?as_and=data+scientist+python&as_phr=&as_any=&as_not=&as_ttl=&as_cmp=&jt=all&st=\
               &salary=&radius=25&l= + Atlanta + &fromage=any&limit=100&start=" + str(start) + "&sort=&psf=advsrch"
        html = requests.get(url)
        soup = BeautifulSoup(html.text, 'html.parser')
        for result in soup.find_all('div', {'class':' row result'}):
            results.append(result)
        sleep(1)
Code Snippet: Getting Full Job Descriptions
for r in slugs[:30]: new_url = 'http://www.indeed.com' + r
print('Requesting content from ' + new_url)
# you can add + '...' res = requests.get(new_url)
# print('Converting content from the res object.')
soup = BeautifulSoup(res.content, 'lxml')
extended_descriptions.append(soup)
sleep(3)
print('Appending soup...')
Code Snippet: Customizing StopWords
custom_stopwords = ['000', '01', '06', '08','10254', '12', '15',
'19', '2018', '22', '25', '28', '45', '500',
'cox', 'norfolk', 'apply', 'com', 'www', 'applications', 'application',
'applicants', 'southern', 'https', 'ia', 'var', 'indeedapply', 'env',
'atlanta', 'opportunity', 'iip', 'gender', 'location', 'new', 'employer',
'midtown', 'manheim', 'ml', 'including', 'llc', 'truck', 'automotive', 'nationality',
'nation', 'iot', 'kelley', 'hopea', 'date', 'incadea', 'honeywell', '100', '1372', '27', '300',
'30308', '30309', '59', '60', '666', '715', '800', '850', '89', '90', 'ga', 'geo', 'genetic',
'mercedes', 'marta', 'lunch', 'familimarity', 'fitting', 'floors', 'furthermore', 'living',
'make', 'members', 'family', 'req149533', 'requisition', 'freshman', 'sophomore', 'et', 'etc',
'etl', 'job', 'invest', 'member', 'eye', 'relocation', 'Unnamed', 'wework', 'yarn', 'yrs',
'test', 'intent', 'intermediete', 'key', 'inflection', 'informatica', 'way', 'recent', 'fewer',
'iteratively', 'joining', 'd3', 'bi', 'bs', 'alteryx', 'benz', 'ai', 'arcgis', 'talend', 'al',
'bus', 'cassandra', 'growing', 'growth', 'guidance', 'bigdata', 'bigquery', 'cotiviti',
'councils', 'like', 'located', 'devops', 'usa', 'winning', 'ex', 'awesome', 'address',
'assurance', 'pig', 'needed', 'id', 'integral', 'impeccable', 'arts', 'auditing', 'community',
'commuter', 'jobs', 'help', 'js', 'human', 'variety', 'stipend', 'rewards', 'sharting',
'daimler', 'degreepreferred', 'advisors', 'characteristics', 'draw', 'donor', 'creek', 'dental',
'medical', 'survival', '0064382_p0223181', '10', '1553', '2016', '24', '30327', '401',
'experiencepredictive', 'emory', 'caffe2', 'caffe', 'workingmother',]
Code Snippet: Using Cosine_Similarity
Credit: https://blogs.oracle.com/meena/finding-similarity-between-text-documents
def get_similarity(dict1, dict2):
    all_words_list = []
    for key in dict1:
        all_words_list.append(key)
    for key in dict2:
        all_words_list.append(key)
    all_words_list_size = len(all_words_list)

    v1 = np.zeros(all_words_list_size, dtype = np.int)
    v2 = np.zeros(all_words_list_size, dtype = np.int)
    i = 0
    for (key) in all_words_list:
        v1[i] = dict1.get(key, 0)
        v2[i] = dict2.get(key, 0)
        i = i + 1
    return cos_sim(v1, v2) * 100;

if __name__ == '__main__':
    dict1 = process('Bullets')
    dict2 = process('Resumes/Updated_Resume_Vectorized.csv')
    dict3 = process('Resumes/Resume_Vectorized.csv')
    dict4 = process('Paragraphs')
    dict5 = process('Job_Descriptions_csv/TruckIT-Desc.csv')
    dict6 = process('Job_Descriptions_csv/Cotiviti.csv')

print("Similarity between the two documents you are comparing is",
get_similarity(dict1, dict2))
print("Similarity between the two documents you are comparing is",
get_similarity(dict1, dict3))
print("Similarity between the two documents you are comparing is",
get_similarity(dict2, dict3))
print("Similarity between the two documents you are comparing is",
get_similarity(dict2, dict4))
print("Similarity between the two documents you are comparing is",
get_similarity(dict3, dict4))
Code Snippet: Summary Table as a DataFrame
import pandas as pd
pd.read_excel('Job Table.xlsx')
</pre>
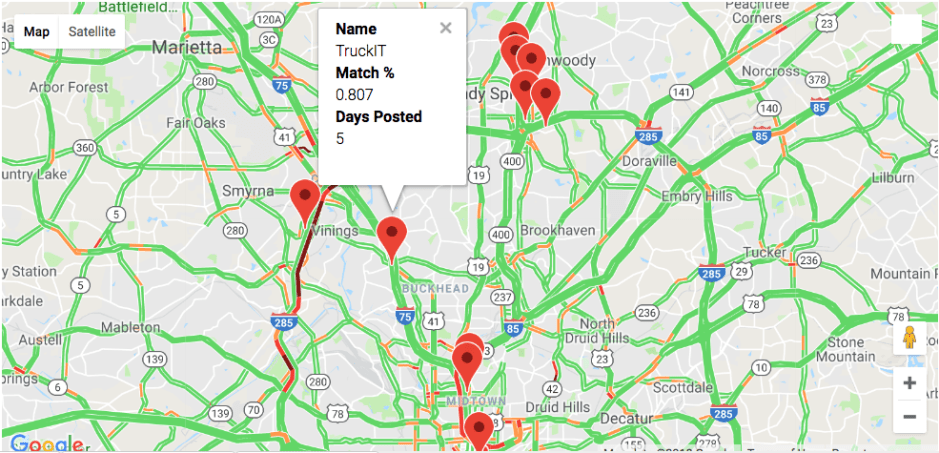
data_science = [ {'name': 'TruckIT', 'location': (33.847387, -84.431586), 'Match Percentage': 0.807, 'Days Posted': 5}, {'name': 'Cotiviti', 'location':(33.934144, -84.35962), 'Match Percentage': 0.665, 'Days Posted': 5}, {'name': 'Home Depot', 'location':(33.86549, -84.481408), 'Match Percentage': 0.688, 'Days Posted': 5}, {'name': 'AnswerRocket', 'location':(33.940736, -84.361513), 'Match Percentage': 0.823, 'Days Posted': 2}, {'name': 'Cox Automotive', 'location':(33.913781, -84.342588), 'Match Percentage': 0.821, 'Days Posted': 5}, {'name': 'TravelPort', 'location':(33.657159, -84.415204), 'Match Percentage': 0.841, 'Days Posted': 5}, {'name': 'Coca Cola', 'location':(33.754155, -84.38139), 'Match Percentage': 0.928, 'Days Posted': 5}, {'name': 'SalesLoft', 'location':(33.786986, -84.388118), 'Match Percentage': 0.896, 'Days Posted': 4}, {'name': 'SoftVision', 'location':(33.791482, -84.386529), 'Match Percentage': 0.645, 'Days Posted': 5}, {'name': 'Aarons', 'location':(34.033083, -84.564686), 'Match Percentage': 0.846, 'Days Posted': 5}, {'name': 'HOME', 'location':(33.968690, -84.785872),'Match Percentage': 0, 'Days Posted': 0}, {'name': 'Inspire Brands', 'location':(33.930034, -84.350866),'Match Percentage': 0.823, 'Days Posted': 5}, {'name': 'Hiscox Insurance', 'location':(33.91708, -84.354513),'Match Percentage': 0.871, 'Days Posted': 6}, ] job_locations = [job['location'] for job in data_science] info_box_template = """<dl><dt>Name</dt><dd>{name}</dd><dt>Match %</dt><dd>{Match Percentage}</dd><dt>Days Posted</dt><dd>{Days Posted}</dd></dl>""" job_info = [info_box_template.format(**plant) for plant in data_science] marker_layer = gmaps.marker_layer(job_locations, info_box_content=job_info) #fig = gmaps.figure(center=(33.753746, -84.386330), zoom_level=11) fig = gmaps.figure(center=(33.753746, -84.386330), zoom_level=11) fig.add_layer(marker_layer) fig.add_layer(gmaps.traffic_layer()) fig
<pre>
For a more thorough breakdown of this project please visit my Capstone Github page:
https://github.com/gitliong/Capstone_DSI
